

How to Calculate and Reduce Labor Cost Percentage in Retail and QSR
Learn how to calculate labor cost percentage, what a good number looks like, why it runs high in retail and QSR, and how smarter scheduling brings it down.
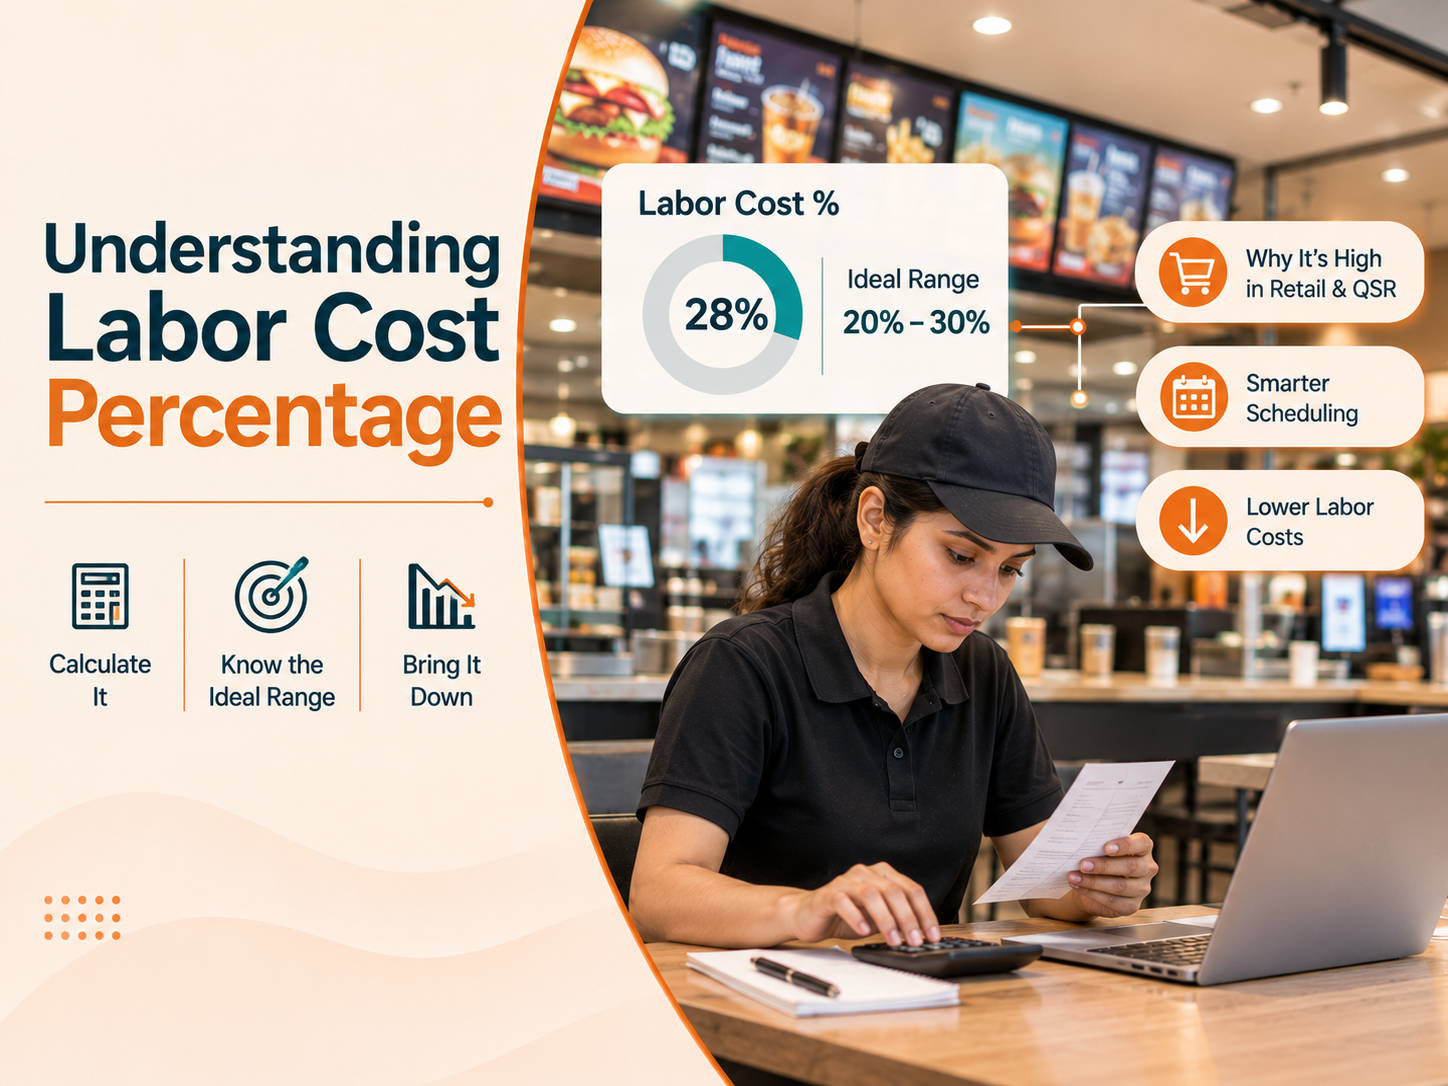
Labor is one of the biggest costs a store manager can control, and much of it is decided before the shift starts, on the roster.
Too many people on a slow afternoon, overtime to cover a gap that was visible days ago, a sick call filled at the last minute: each is small, but across a month and many outlets they add up.
This guide explains how to calculate labor cost percentage, what a healthy number looks like, and how to bring it down without hurting service.
At a glance
- Labor cost percentage = labor cost ÷ sales × 100
- A good number depends on the format, so benchmark against your own outlets first
- The biggest drivers are rosters that ignore demand, overtime, absences and turnover
- Reducing labor cost means matching staff to the work, not cutting staff
What Is Labor Cost Percentage and How Do You Calculate It?
Labor cost percentage shows how much of your sales goes to paying your team.
Labor cost percentage = (Total labor cost ÷ Total sales) × 100
Total labor cost covers more than base pay:
- Hourly and salaried wages
- Overtime and premium pay
- Bonuses and incentives
- Benefits and paid leave
- Statutory contributions such as PF and ESI, where applicable
- Uniforms and training tied to staff
For illustration, take an outlet that sells Rs 10,00,000 in a month and spends Rs 2,80,000 on labor, all costs included. Its labor cost percentage is 28%.
Track it often, by outlet, by week and by daypart. A 28% monthly average can hide an outlet running 40% in slow afternoons and 18% at lunch.
What Is a Good Labor Cost Percentage?
There is no single right number. It depends on format, category, service model and market.
As a rough reference, a Toast guide for restaurants cites an average of about 25% to 35% of revenue, with quick service around 20% to 25%. Petpooja, an India restaurant technology company, also puts staff cost at 25% to 35%, and cloud kitchens at 20% to 25%. Both are industry guides, not audited benchmarks, and retail varies widely by category.
A better benchmark is your own network:
- Compare outlets of the same format and similar sales
- Study the best performers and see what their rosters do differently
- Track your own trend over time
If two similar outlets sit several points apart, the cause is usually scheduling and process. Our post on what makes one QSR chain different from another explains why format changes the right target.
Why Labor Cost Runs High in Retail and QSR
- Rosters that ignore demand: The same staffing every day means too many people in quiet hours and too few at peak
- Avoidable overtime: Recurring gaps get covered with overtime instead of better planning
- Absences and no-shows: Last-minute cover is rushed and costly
- Turnover: Hiring and retraining add cost that never shows on the roster, as covered in our post on faster onboarding for high-turnover locations
- Late visibility: The cost appears in the month-end report, long after the roster that caused it
In the example outlet, Friday lunch is always busy, yet the roster is copied from last week. The same six people cover the 12 PM peak and the 4 PM lull, two are idle in the afternoon, and one is on overtime at lunch because a sick call was covered late. Repeated across outlets, small gaps like these move the percentage.
How to Reduce Labor Cost Without Hurting Service
The goal is to match labor to the work, not to schedule fewer people.
- Schedule by daypart: Staff to expected demand, not a flat headcount. Our guide to demand forecasting in QSR shows how a forecast becomes a staffing plan
- Plan overtime, don't discover it: Review planned hours before the week starts and fix recurring gaps in the roster
- Cross-train staff: People who can move between counter, kitchen and floor make quiet hours cheaper and rushes smoother
- Use shift swaps and open shifts: A clear way to fill a gap cuts the cost of last-minute cover. Our workforce scheduling best practices cover how to set the rules
- Compare planned and actual hours: The gap shows where rosters and reality drift apart
- Improve retention: Every person who stays is one fewer hire to train
In the example outlet, the Friday roster adds two people at lunch and trims two from the afternoon. Overtime falls because the peak is planned for, and the percentage drops without a single customer waiting longer.
The same logic applies in retail. A fashion store typically sees its busiest hours on weekends and during sale periods, while weekday mornings stay quiet. Moving hours from those quiet mornings to weekend afternoons and sale days puts staff on the floor when customers are there, so fitting rooms, billing and floor assistance are covered without adding total hours.
Managing Labor Cost Across Multiple Outlets
Controlling labor cost in one outlet is a manager's job. Across 20 or 200, it is a system problem.
- Formats differ: A dine-in outlet, a drive-thru, a kiosk and a cloud kitchen carry different healthy ranges, so one target for the whole brand misleads
- Outlets drift apart: Without one view, similar stores settle into different habits
- Staff move: People working across outlets can build overtime no single manager sees
What helps is grouping outlets by format and sales level, reviewing labor cost by outlet and daypart weekly, setting common rules for shift length and overtime, and giving regional managers a view of planned hours before the week begins. Spreadsheets stop being practical here, as our post on whether Excel is good enough for employee scheduling explains.
How Scheduling Software Helps Control Labor Cost
Research points the same way:
- A 2021 Nucleus Research analysis of workforce management case studies reported that automated scheduling can cut the time managers spend creating schedules by an average of 75%, and that organizations reduced total payroll spend by more than 5% on average
- McKinsey found that retailers taking a data-driven approach to labor scheduling captured 4% to 12% in cost savings while also improving customer service
These describe the cases studied, not guaranteed results. Savings depend on forecast accuracy, local labor rules and how managers act on the data.
In practice, workforce scheduling software supports labor cost control through:
- Demand-based rosters built from sales history, footfall and seasonality, with auto-fill to speed up roster creation
- Overtime, leave and conflict flags before the roster is published, backed by labor compliance rules
- Planned labor cost by outlet, visible before the week and not after the month
- Shift swaps and replacements handled in the system
- One view across outlets, including grouping outlets into clusters
Managers still review and adjust every roster. They just start from a draft built on demand.
Labor Cost Metrics to Track
- Labor cost percentage by daypart: shows which hours drive the average
- Sales per labor hour: sales divided by hours worked, a measure of how productive each hour is
- Overtime hours: how many, where and how often
- Planned vs actual hours: how far the roster drifts from what happened
- Coverage gaps: hours that ran short at peak
Review labor next to food cost, since the two together make up prime cost. Savings in one can be lost in the other if wastage or stock-outs rise.
Is Your Labor Cost Under Control?
A quick test: can you tell today what labor cost percentage each outlet ran last week, and which hours were overstaffed or short? If the answer takes a day of collecting files, the visibility problem is already costing you.
A short conversation can show what demand-based scheduling looks like on your own outlets, peaks and rules.
Book a personalized demo to see how NymbleUp's Workforce Scheduling solution helps multi-location retail and QSR brands plan labor around demand.
FAQ
How do you calculate labor cost percentage? Divide total labor cost by total sales and multiply by 100. Include wages, overtime, bonuses, benefits, paid leave and related staff costs, not base pay alone.
What is a good labor cost percentage for a restaurant or QSR? It varies by format and market. Industry guides commonly cite about 25% to 35% of revenue for restaurants, with quick service and cloud kitchens often lower, around 20% to 25%. The best benchmark is your own outlets of the same format.
How can I reduce labor cost without reducing service? Match staffing to demand by daypart, plan overtime in advance, cross-train staff, use shift swaps and open shifts for gaps, and compare planned and actual hours regularly.
Can scheduling software reduce labor cost? It can help by building rosters from demand, flagging overtime and conflicts, and showing planned labor cost across outlets. Savings depend on data quality, forecast accuracy and how managers use the information.
How do you manage labor cost across multiple outlets? Group outlets by format and sales level, compare within each group, review labor cost by outlet and daypart weekly, set common rules for shifts and overtime, and use one system that shows planned hours and cost across locations.
What is sales per labor hour? Total sales divided by total hours worked in a period. It shows how much revenue each labor hour supports, which helps compare outlets and dayparts.
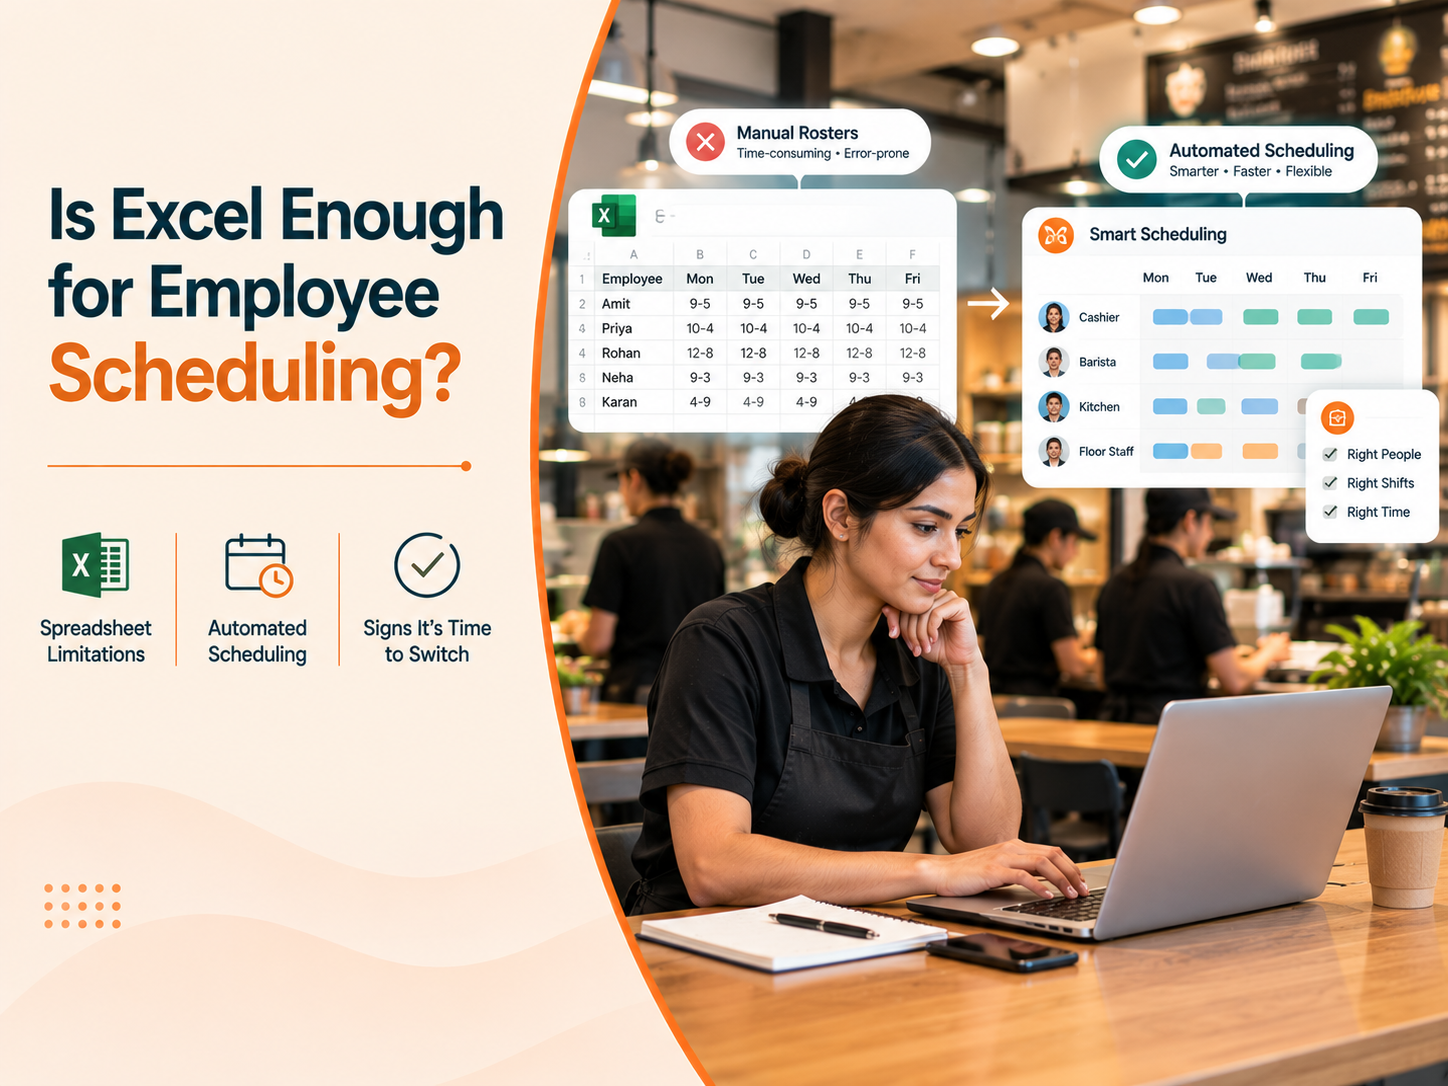
Is Excel Good Enough for Employee Scheduling? When to Switch to Software
Is Excel enough for employee scheduling? See where spreadsheet rosters break down, what automated scheduling does differently, and the signs…
Read more
How Video Analytics Reveals Who's Actually Walking Into Your Store
Discover how AI video analytics helps retailers gain real time demographic insights, understand visitor patterns, personalise offers, optimi…
Read more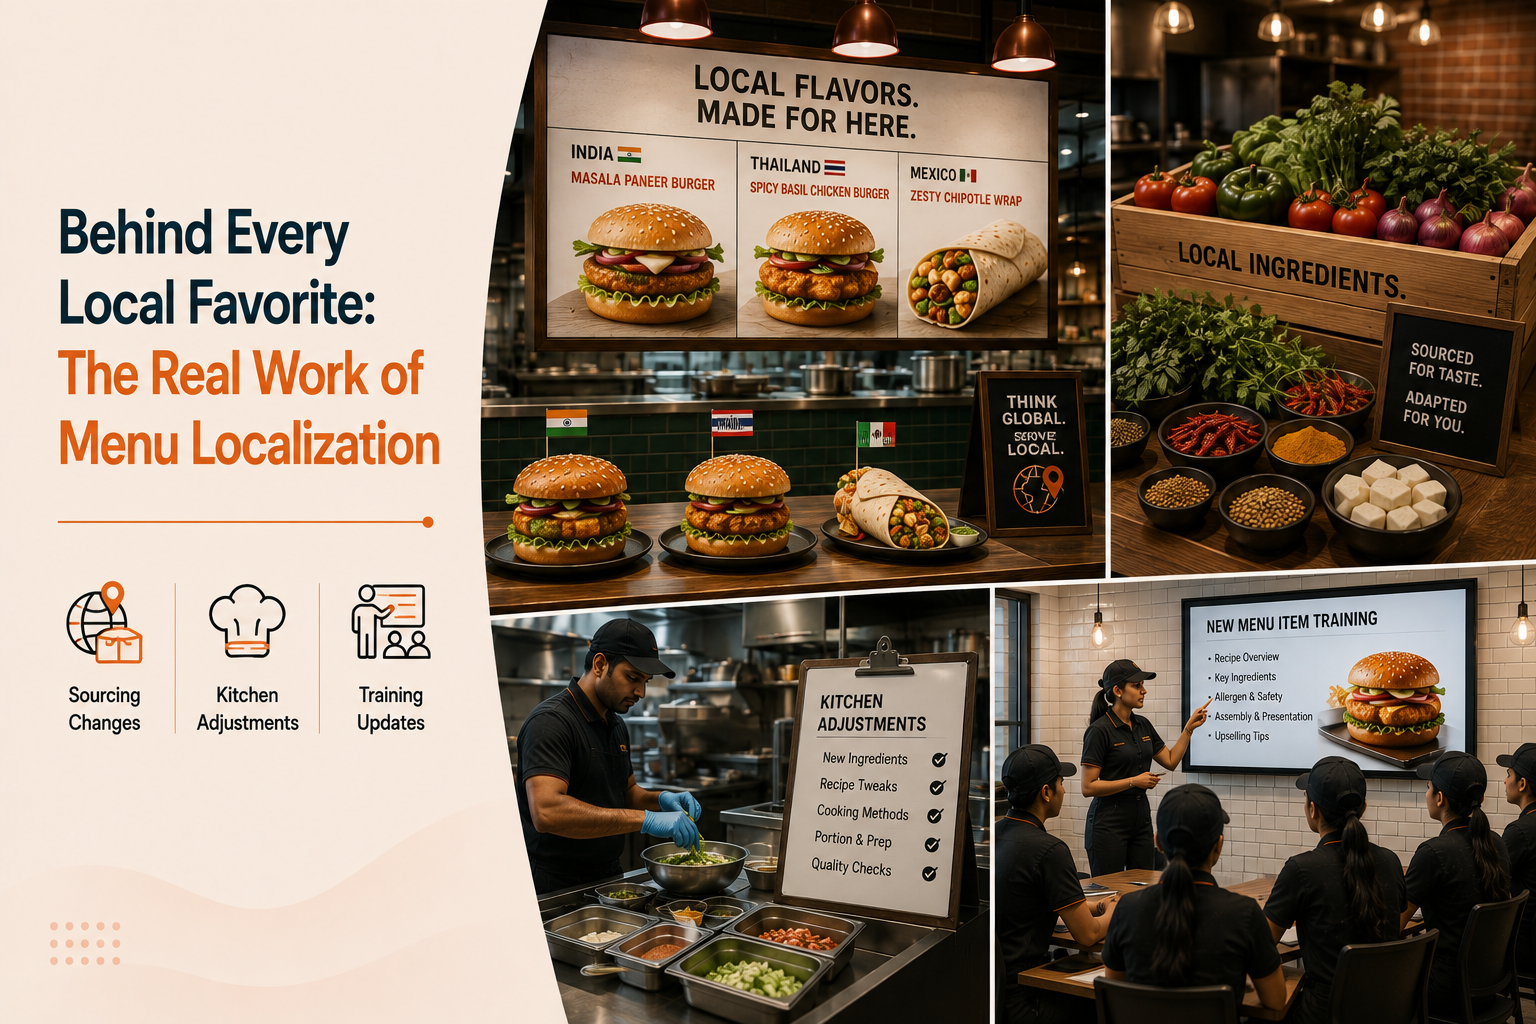
How QSR Brands Adapt Menus for Different Markets and Cities
Menu localization isn't just a new item on the board. Here's the sourcing, kitchen, and training changes that actually happen behind a regio…
Read more