

Demand Forecasting in QSR: How Outlets Predict Orders, Prep, and Staffing
Learn how QSR demand forecasting helps predict orders, plan food preparation, optimize staffing, manage perishability, and improve outlet operations.
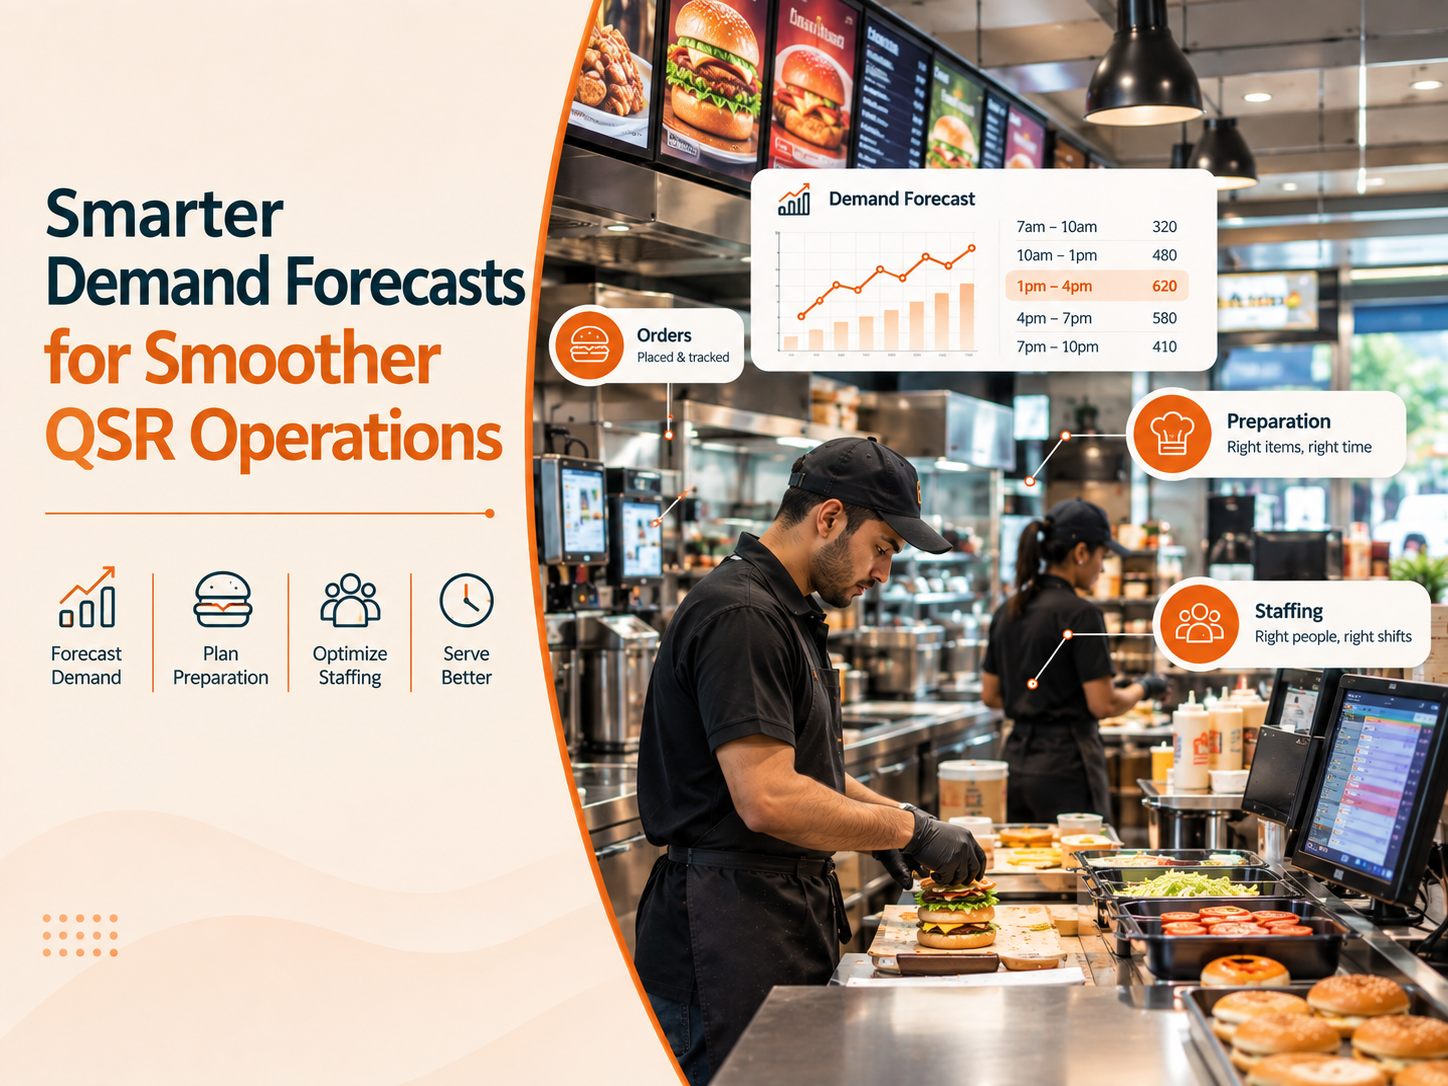
A busy QSR outlet rarely has a problem because customers are coming in.
The real challenge is knowing how many customers will come in, when they will arrive, what they are likely to order, and how much staff and inventory will be needed to serve them efficiently.
The scale of the problem is bigger than most operators realize. Only about 36% of restaurants actually hit their labor cost targets, while 44% consistently spend more than planned. Labor already sits among the top three concerns for a large majority of restaurant operators, and in several major markets, QSR labor costs rose over 6% in a single recent year, driven largely by minimum wage increases. Against that backdrop, guessing at staffing isn't a minor inefficiency, it's one of the most expensive blind spots in the business.
If an outlet prepares too much, food gets wasted. If it prepares too little, customers face longer wait times and popular items may go out of stock. If staffing does not match demand, employees become overloaded during peak hours and underutilized during slower periods.
This is where demand forecasting in QSR operations becomes important. It uses historical sales, operational data, seasonal patterns, dayparts, external factors, and other inputs to estimate future demand. For multi-outlet QSR brands, it can help connect three critical areas of operations:
Orders → Preparation → Staffing
What Is Demand Forecasting in QSR?
QSR demand forecasting is the process of estimating the expected number and type of orders an outlet will receive during a specific period.
Forecasting can be done at different levels:
- Daily demand
- Daypart or hourly demand
- Product or category demand
- Channel-wise demand
- Outlet-level demand
- Store cluster or regional demand
A QSR outlet may expect significantly different demand during breakfast (8-11 AM), lunch (12-3 PM), evening (4-6 PM), and dinner (7-10 PM). A weekend may follow a completely different pattern from a weekday. A food delivery promotion may shift demand toward online channels, while a local event could increase physical footfall.
The goal isn't simply to predict sales. It's to translate expected demand into better operational decisions.
What Data Actually Goes Into a Forecast
Accurate forecasting depends on the quality and variety of data available.
Historical Sales Data
Past sales are one of the most important forecasting inputs, orders per day, orders by hour, product-level sales, average order value, and weekday versus weekend performance all help identify recurring patterns that are difficult to spot manually. If an outlet consistently receives 30% more orders between 7 and 9 PM on Fridays, the team can plan for that in advance instead of reacting once the rush begins.
Dayparts
Demand is rarely consistent throughout the day. Forecasting by daypart shifts the question from "how many orders will we get today" to "how many orders should we expect between 12 and 2 PM," a distinction that makes workforce planning far more precise. This same daypart logic shows up clearly in our look at café customer behavior by time of day, where the entire customer mix, not just order volume, shifts hour to hour.
Weekday and Weekend Patterns
Monday demand can look nothing like Saturday demand. Forecasting models account for recurring patterns, higher weekend footfall, Friday evening spikes, Sunday family orders, payday-related shifts, and holiday periods, so outlets aren't planning every day around a single flattened average.
Product and Menu Mix
Knowing the number of orders is only part of the equation. Forecasting 500 orders is useful, but knowing the likely split across burgers, sides, beverages, and desserts within those orders gives teams far more to actually plan preparation, ingredients, and packaging around.
Perishability
Food businesses face a forecasting challenge most retail categories don't: limited shelf life. Over-preparation drives food waste and higher ingredient costs. Under-preparation drives stock-outs and a worse customer experience. Forecasting exists to find the balance between the two.
Order Channels
Modern QSR demand rarely comes from one source, walk-ins, self-order kiosks, brand apps, delivery aggregators, drive-through, and takeaway can each carry a distinct demand pattern. Delivery orders may spike during rain while walk-in traffic drops, for instance. Understanding channel mix helps outlets prepare for the type of demand, not just the total volume. This is also where format matters: a dine-in, drive-thru, or cloud kitchen setup each generates a fundamentally different demand curve, even serving the same menu.
Promotions and Campaigns
Discounts, combo offers, and new product launches can shift demand well beyond what historical averages alone would predict. Forecasting systems that incorporate planned campaigns and past campaign performance give a more realistic estimate than historical data alone.
Seasonality and External Factors
Festivals, public holidays, school schedules, weather, local events, and payday cycles can all pull demand away from its usual pattern, and accounting for them is part of why a flat, average-based forecast consistently misses the mark during exactly the weeks that matter most.
How Forecasting Connects Orders, Preparation, and Staffing
The real value of forecasting shows up once the prediction is connected to daily outlet operations, in three steps:
- Forecast expected orders — for example, expected lunch demand of 180 orders
- Translate orders into preparation requirements — 180 expected orders becomes an estimated burger, side, beverage, and packaging requirement
- Translate demand into staffing requirements — if demand is expected to peak between 1 and 2 PM, the outlet schedules additional staff specifically for that window, rather than holding a flat headcount all day
Why Static Rosters Struggle During Peak Hours
Many QSR outlets still run on fixed staffing patterns, ten employees from 10 AM to 6 PM, regardless of how demand actually moves through the day. Real demand usually looks more like low at 10 AM, rising by noon, peaking sharply at 1 PM, still high at 2 PM, and tapering by 4 PM. A fixed roster doesn't reflect any of that. Demand-based workforce planning aligns staffing with expected workload instead, better coverage during peak periods without unnecessarily padding labor hours during the slow stretches.
What Underestimating Demand Actually Costs
Under-forecasting creates real operational pressure, longer wait times, kitchen bottlenecks, employee overload, stock-outs, delayed delivery orders, and missed sales.
The cost is more concrete than it might seem. Industry research into restaurant operations has estimated that a single understaffed peak shift can cost a restaurant several hundred dollars in lost table turns and reduced service capacity, before even accounting for the customer experience damage of a long wait or a stocked-out item during the exact window a brand most needs to perform well. In a multi-outlet business, that cost multiplies across every location it happens at.
What Overestimating Demand Actually Costs
Over-forecasting creates a different, quieter problem, food wastage, higher labor costs, excess inventory, and reduced outlet profitability, all from preparing for a rush that never fully arrived.
Labor alone typically runs between 25% and 35% of restaurant revenue, which is part of why even small forecasting errors compound quickly across a multi-outlet business. Operators relying purely on manual, spreadsheet-based planning have reported labor costs running meaningfully higher than brands using structured, data-driven forecasting, often by several percentage points of revenue, a gap that adds up fast once multiplied across dozens or hundreds of outlets.
The goal was never to forecast the highest possible demand. It's to build a more accurate, more actionable estimate.
How AI Improves the Forecast Itself
Traditional forecasting leans heavily on historical averages and manual adjustment. AI-powered forecasting can process a much larger set of inputs at once, historical sales, daypart, outlet performance, product mix, seasonality, channel mix, and promotions, and refine the forecast continuously as new data comes in. Restaurant groups that have connected POS data directly into their forecasting have reported accuracy approaching the mid-90s percent range, a meaningful jump from the rougher estimates manual planning typically produces.
Worth noting: a lot of workforce tools in this category are built primarily to make a schedule easy to create and share, a digital version of a paper roster, rather than to actually predict what that schedule should be. A tool that communicates a schedule well still leaves the hardest, highest-value part of the work, the actual forecasting, sitting in a manager's head. The real gain comes specifically from connecting forecasting and scheduling into one continuous process, not treating them as two tools that happen to sit next to each other.
For multi-location brands, this matters even more, since an outlet on a high street behaves differently from one inside a mall, airport, food court, or residential neighborhood.
Managing Forecasts Across Many Outlets
For a single outlet, demand forecasting can be managed manually to some extent. For a brand running 50, 100, or 500+ outlets, doing this consistently becomes far harder. Central operations teams need visibility into expected demand by outlet, peak periods, staffing requirements, product demand, outlet-level variation, and forecast versus actual performance, all without losing the individual pattern each location actually has. A centralized forecasting and workforce platform is what makes standardizing this possible without flattening every outlet into the same average.
From Forecasting to Better Operations
Demand forecasting shouldn't exist as a standalone report. Its real value comes when the forecast drives an action, forecast demand, plan preparation, build the roster, execute, compare actual against forecast, and improve the next one. That loop, repeated consistently, is what separates a brand that's actually using its data from one that's just collecting it.
This connects directly to how individual store sections and SOPs and checklists actually get executed day to day, a forecast only pays off once it's translated into a documented, trackable process on the floor, not left as a number in a report nobody acts on.
Book a personalized demo to see how NymbleUp's Workforce Scheduling solution helps multi-location QSR and retail brands move from static rosters to demand-driven staffing, built on historical sales, POS data, footfall, and seasonality.
FAQ
What is demand forecasting in QSR operations? Demand forecasting is the process of estimating how many orders, and what kind, a QSR outlet will receive during a given period, using historical sales, daypart patterns, seasonality, and other data to guide preparation and staffing decisions.
How does demand forecasting improve staffing? By connecting expected order volume to specific time windows, forecasting lets outlets schedule more staff during predicted peaks and fewer during predicted lulls, rather than running a flat headcount across the entire day regardless of actual demand.
What happens if a QSR outlet underestimates demand? Underestimating demand typically leads to longer wait times, kitchen bottlenecks, stock-outs on popular items, and missed sales, costs that research suggests can run into several hundred dollars for a single understaffed peak shift.
Can demand forecasting work across hundreds of outlets at once? Yes, though it requires a centralized platform rather than manual, outlet-by-outlet planning. A centralized system can account for each location's individual demand pattern, a mall outlet behaves differently from a high-street one, while still standardizing the forecasting process across the whole brand.
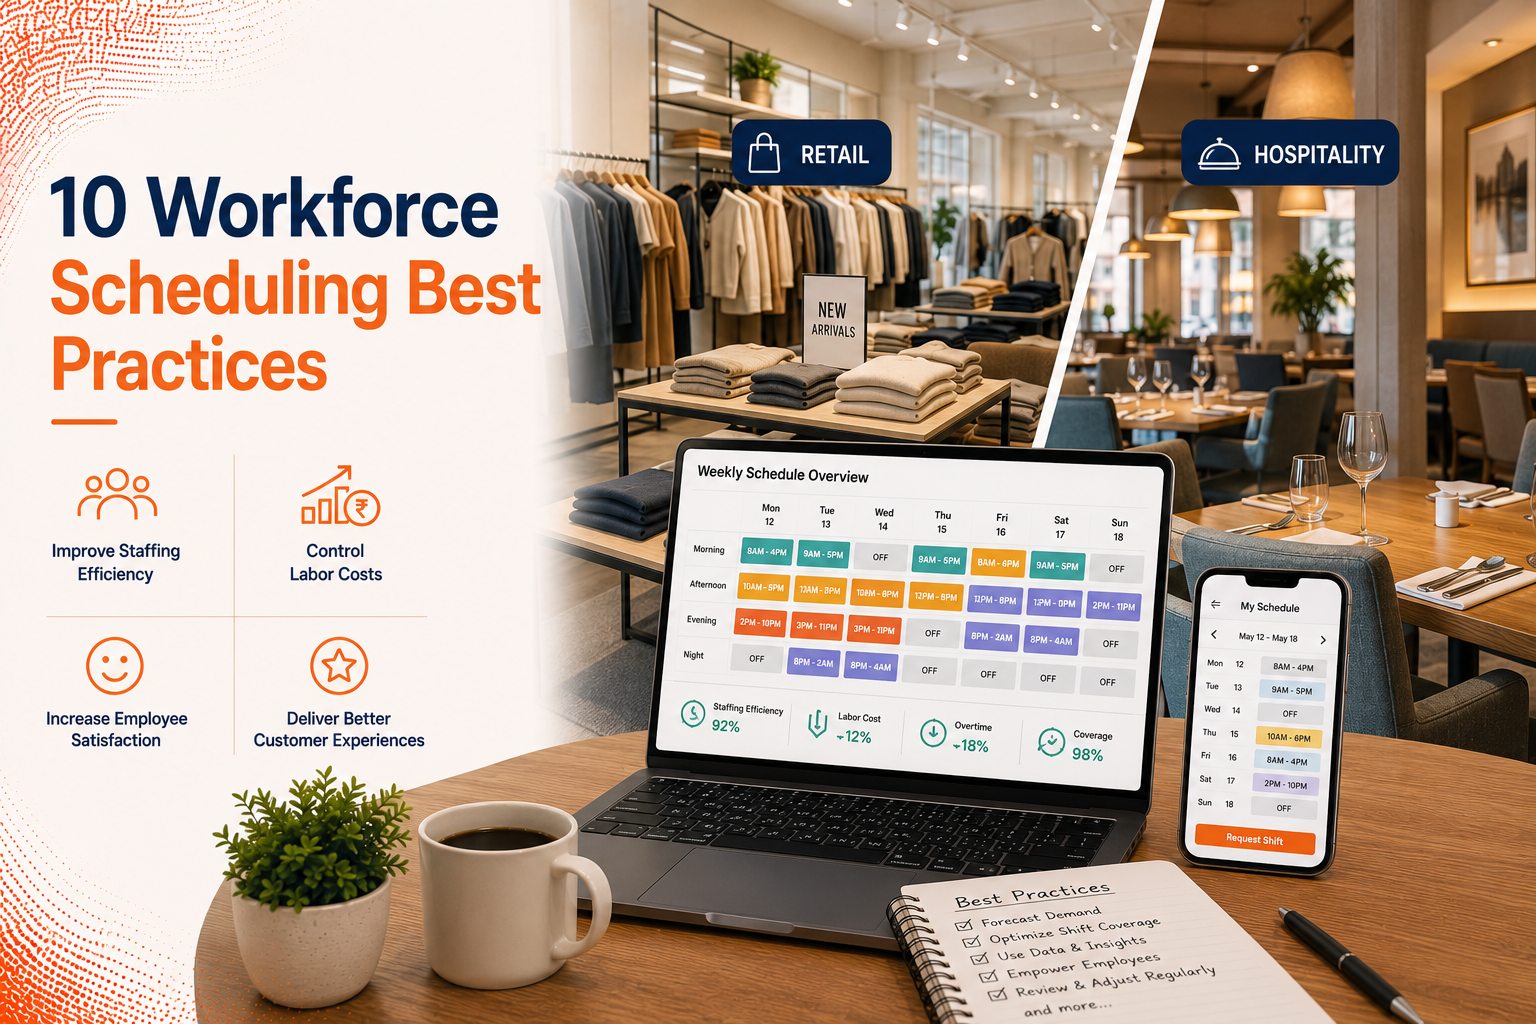
10 Workforce Scheduling Best Practices Every Business Should Follow
Discover 10 workforce scheduling best practices that help businesses improve staffing efficiency, control labor costs, increase employee sat…
Read more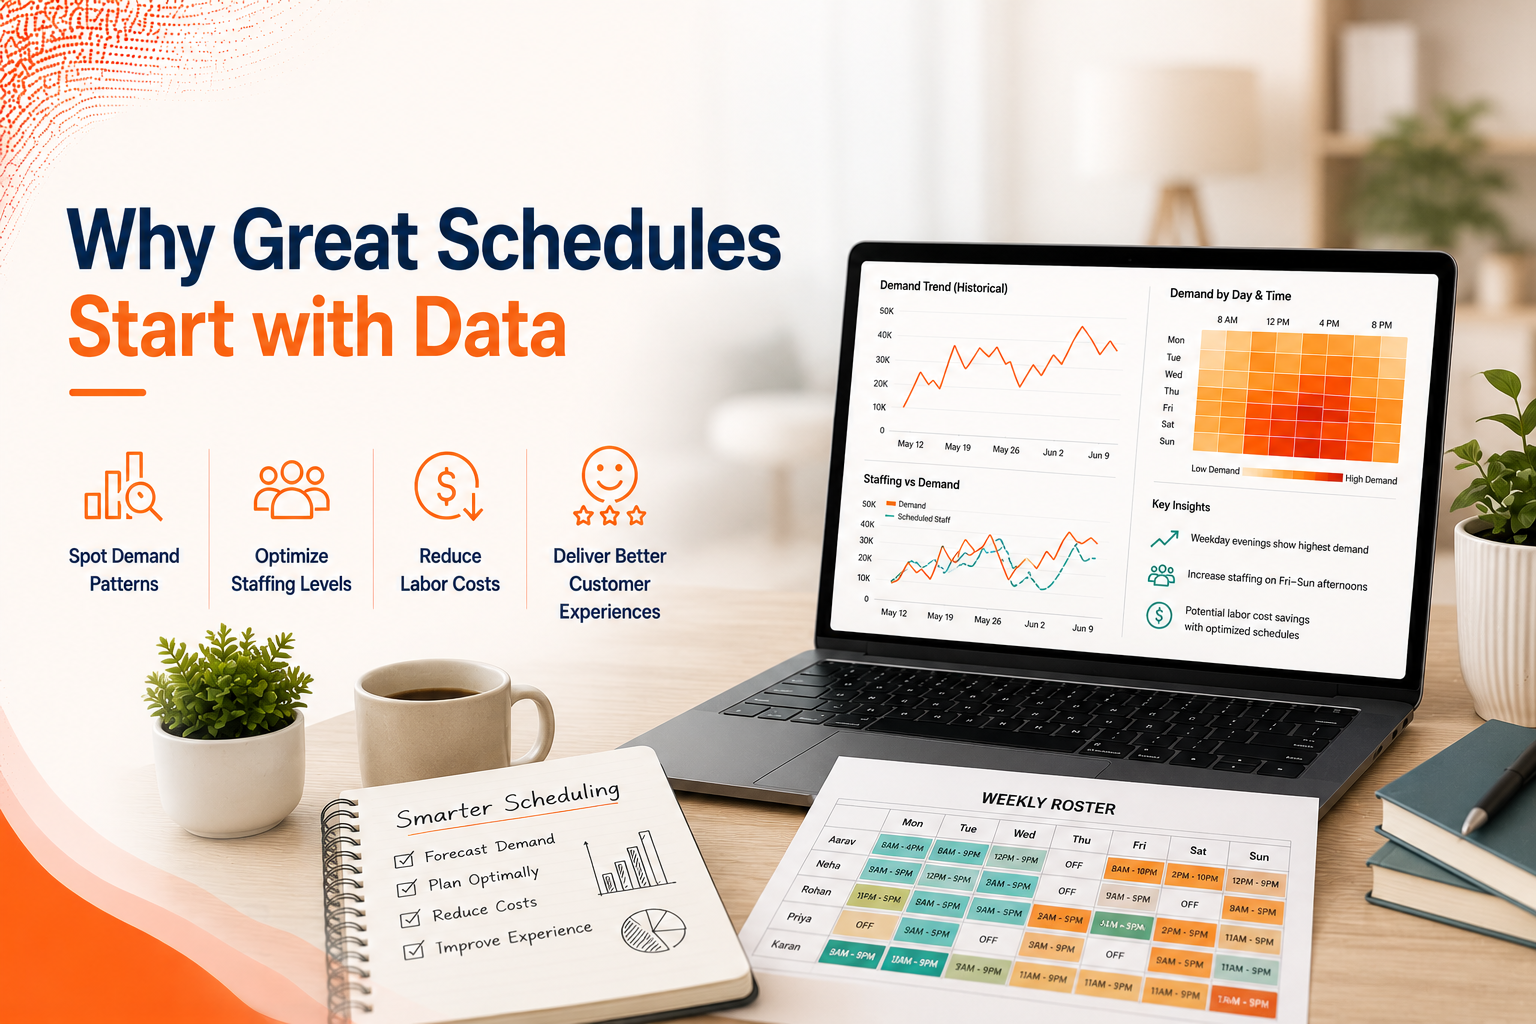
How Historical Data Improves Workforce Scheduling
Learn how historical data helps businesses improve workforce scheduling by identifying demand patterns, optimizing staffing levels, reducing…
Read more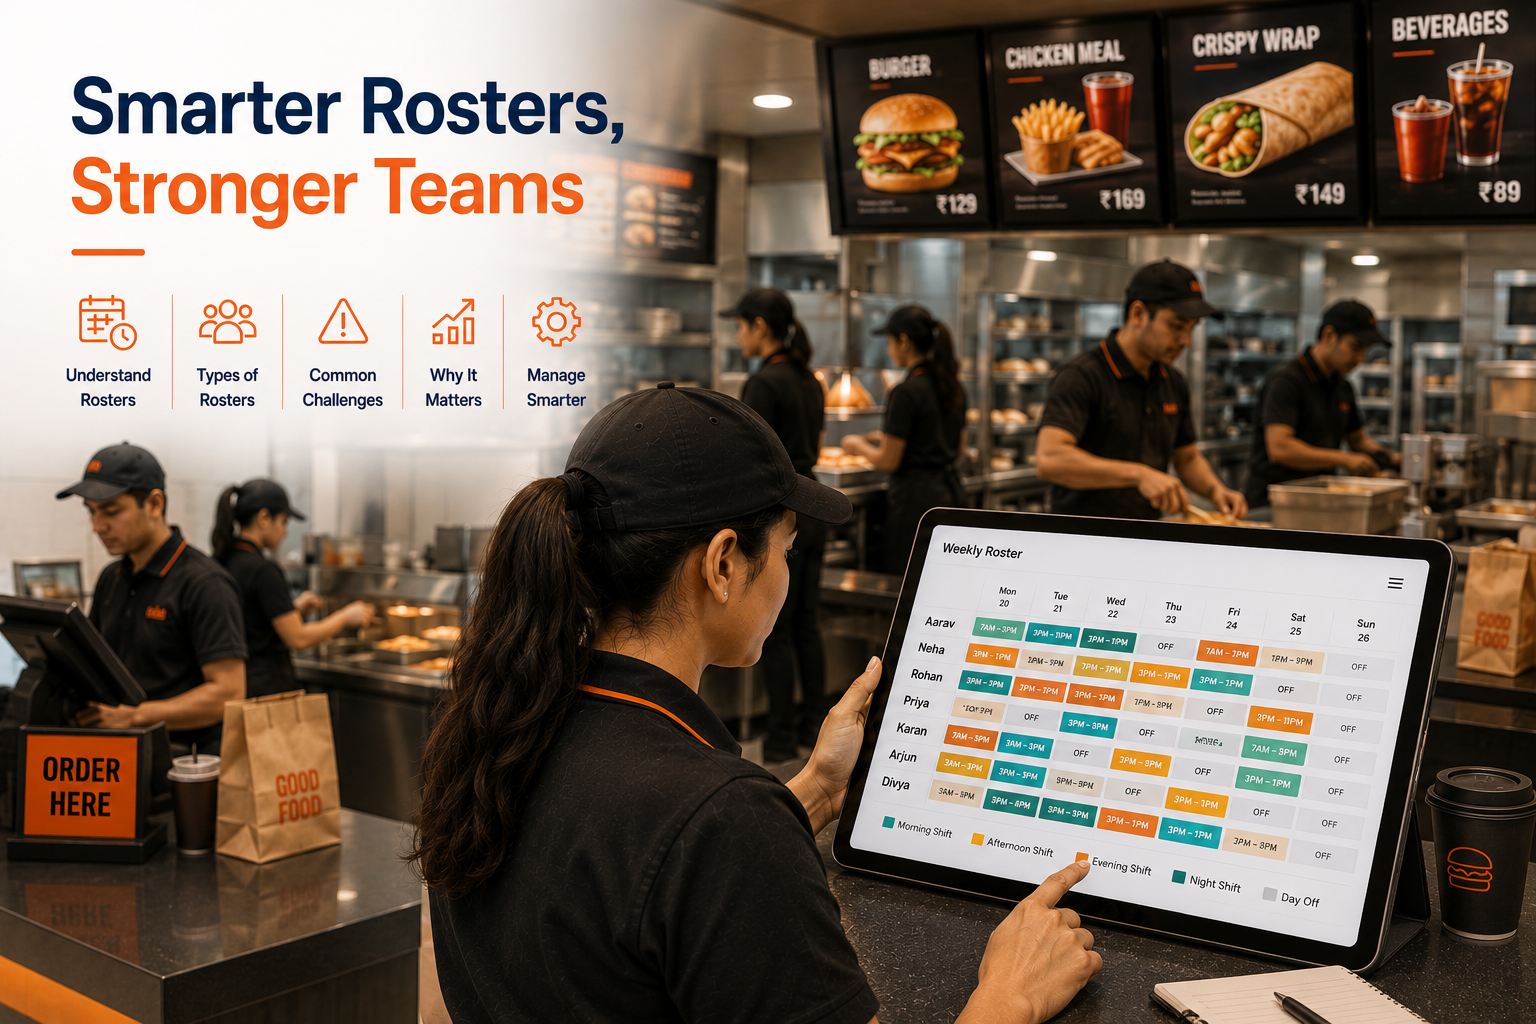
What Is an Employee Roster? Everything You Need to Know
Learn what an employee roster is, why it matters, the different types of employee rosters, common rostering challenges, and how businesses c…
Read more